Read Mark Amerika’s Meta/Data, over the past two days. I enjoyed it so much. His writing is sometimes funny and I found many of the points so useful to my work. Some of my thoughts were written after reading a couple of the essays, and I found it helpful that it prompted me to think about how I can write about my process and concept better.
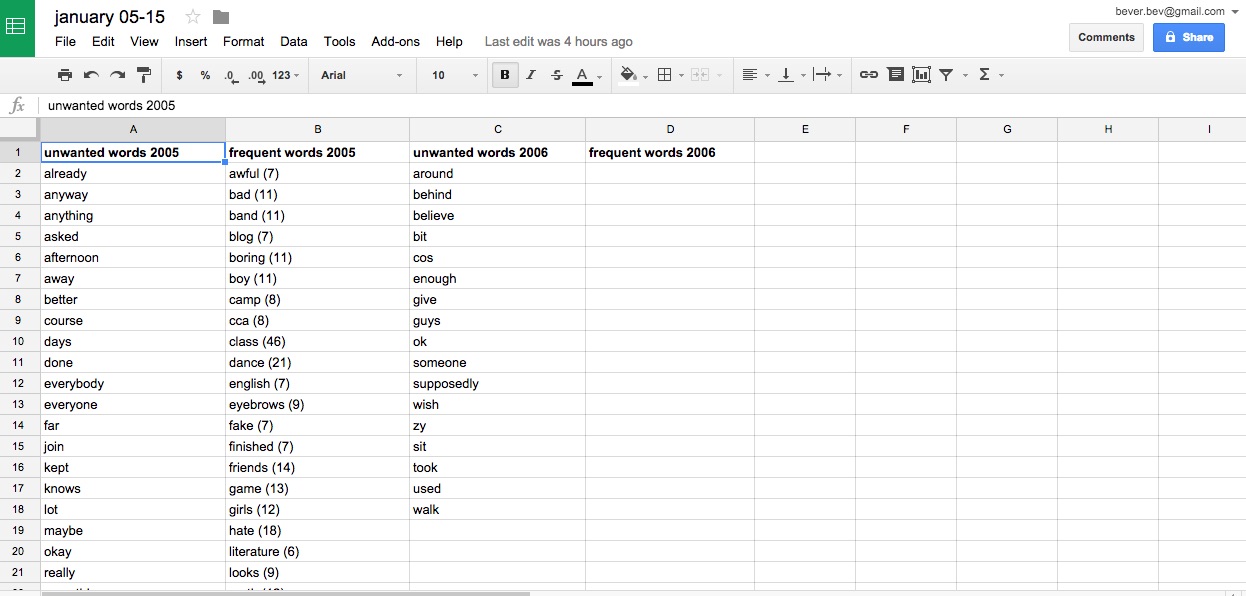
My findings, in point form currently. Trying to integrate it with the rest of my report.
And here’s my finalised project title at last:
life in pixels: an autobiographical work in progress
- project’s contribution to VC?
- visual communication as an expanding field, pushing boundaries of traditional VC practice.
- not limiting myself to graphic design.
- moving beyond print media.
- hybrid processes
- explore beyond 2D page of print media and integrating technology and the Internet into my work
- mining digital terrain for autobiographical purposes (self-portrait)
- built-in obsolence of virtual memories. compare digital archiving with physical archiving
- the persona vs the character. exploring the projection of self through various media, what it means
- physical journals contain the touch of hand and the tactility of print. what is its technological counterpart and how can i show that through my work?
- visual vocabulary and language of the internet
- context: what is net art like before 2000? what does this new media mean for artists’ practices then?
- how far did they come from the early networked/performance art (i.e Nam June Paik) and other performer-artists?
- tools are easily accessible to my generation. we are able to immediately make art with photoshop at hand. online communities are youth-led, often explore the potential of integrating traditional and digital ways of making art.
- easy for us to use these tools to our advantage and narrate our stories.
- the impermanence of time in a data-driven environment. what’s time like on the internet.
- what does archiving and collecting mean to me and my art practice?
- the glitch as a reimagined metaphor in my artwork.
- quantifying one’s life through data-collecting, all of this is part of a larger story: the public vs private
- research and process is the narrative
- vannevar bush: trails that are not frequently followed are prone to fade, items are not fully permanent, memory is transitory
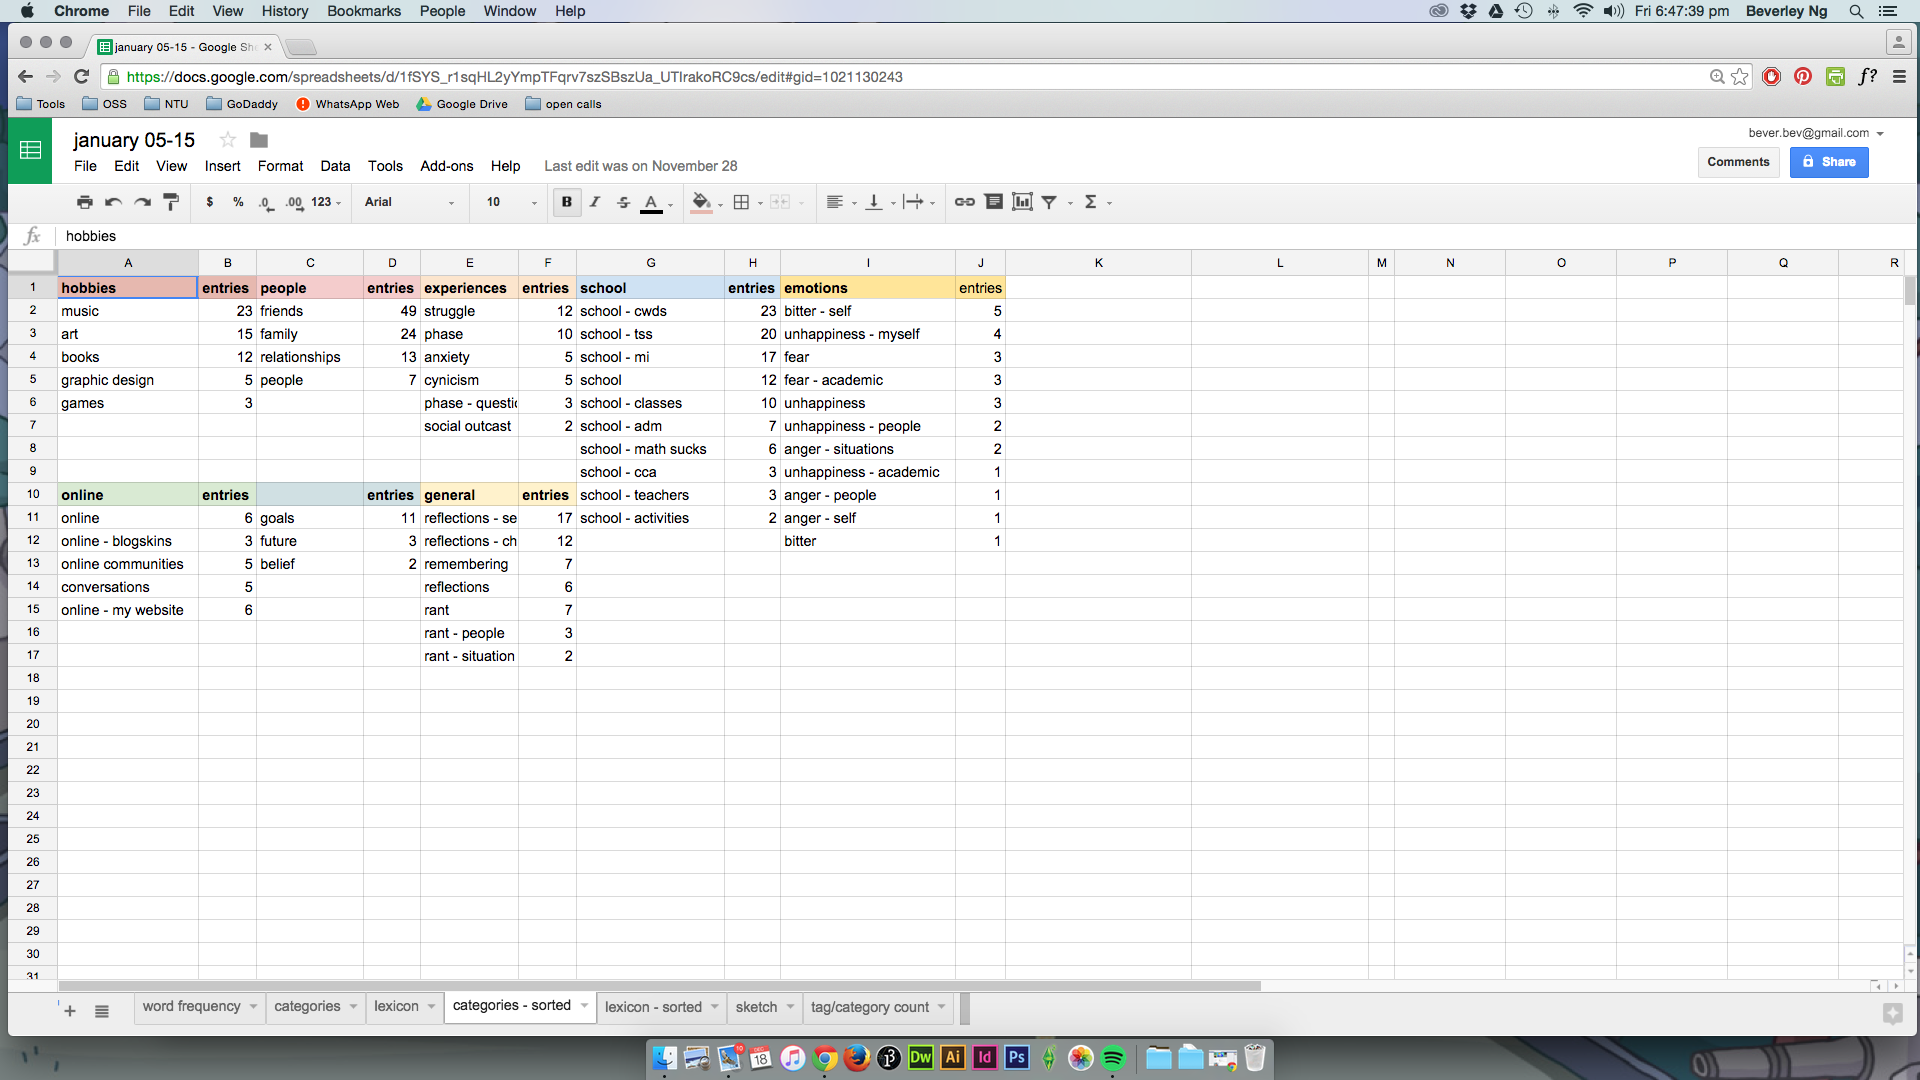
- blog entries = experiential content, experiential database
- benefits of creating an alchemical remix of narrative strategies
- my desire to run away from social media and virtual affirmation
- the digital source material, ready for immediate remix, reinterpretation at a click
- new media experience. my web identity
- internet of time, built-in obscolence
- net artist who capture consciousness with readily available digital apparatus
- an autobiographical work in progress
- i operate in a more fluid, interdisplinary lifestyle
- on remixing: i can look back of whatever traces i left behind and reapply my conscious to it again
- flux online persona: ‘heroine’, my teenage online identity
- burrowing underground for shards of light. source material. my work is all source material.
- look at specific themes that have been at the core of my practice (hybridized)
- write, draw, make
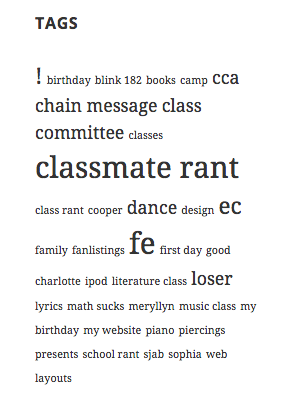
- big issue themes such as feeling alien in status quo culture, tapping spiritual unconscious, alienation, bullying, rigidity of academia, rule-based system, beauty differences, turning all that into an autobiographical work in progress memoir
- instant gratification: what the internet gives us, and what this generation will feel much of the consequences of. what are the long term effects of instant gratification?
- making art for an online audience who are always ever ready to accept them
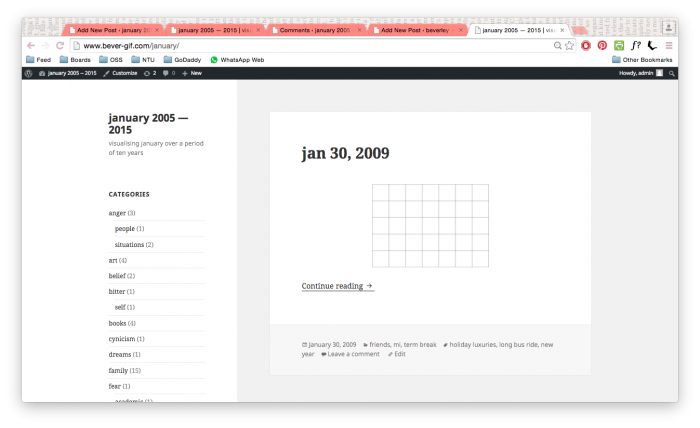
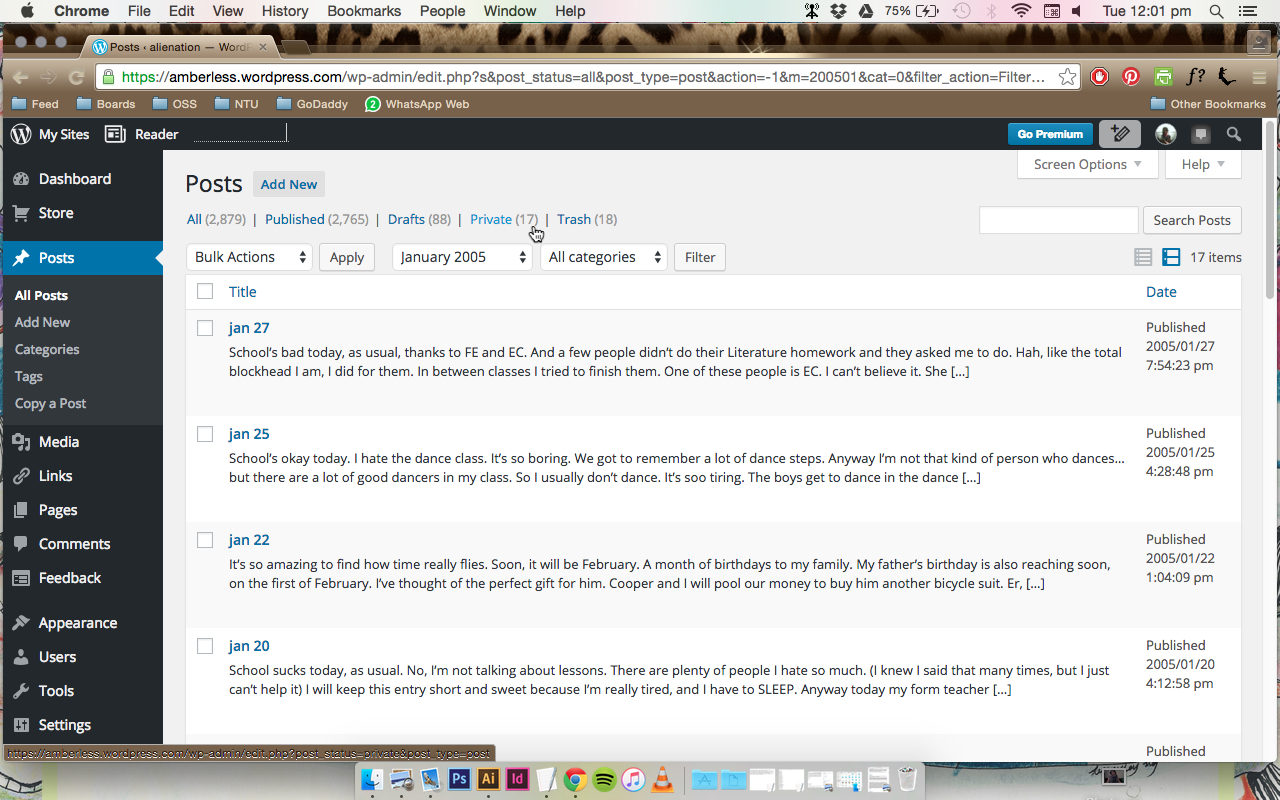
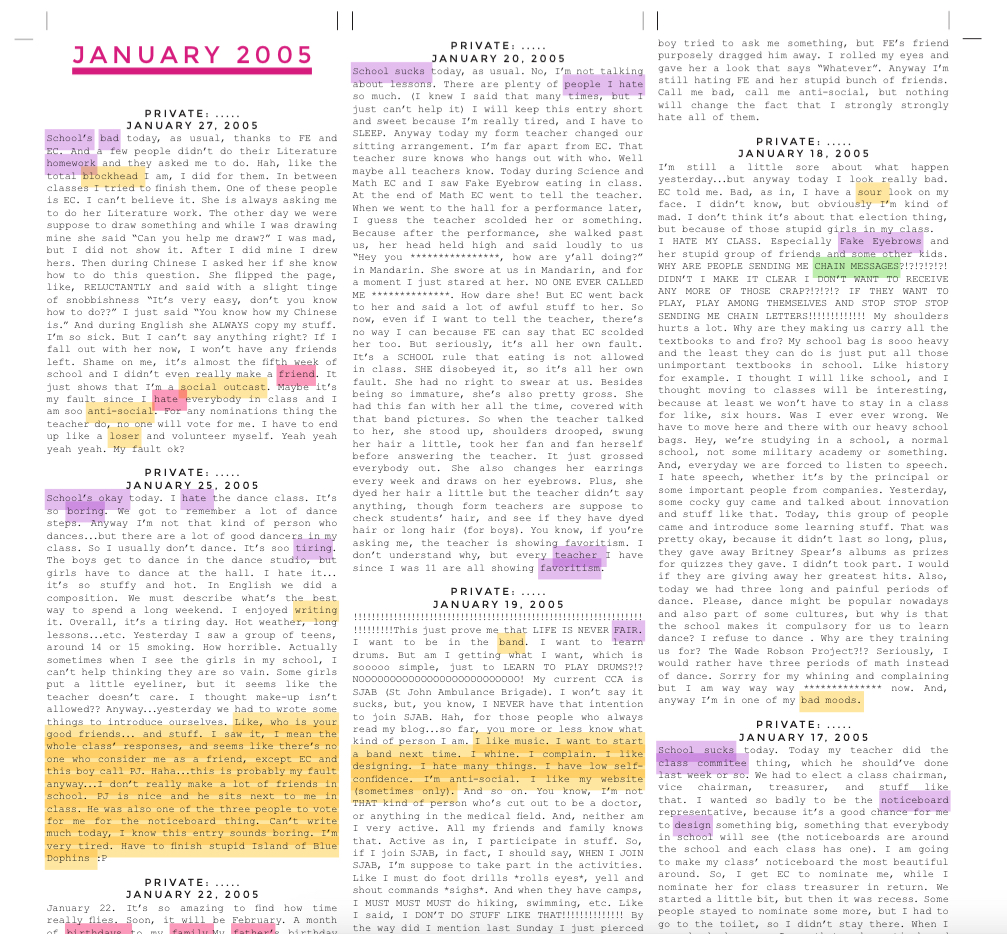
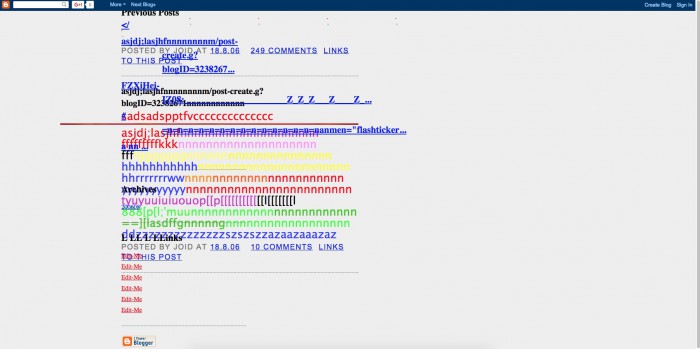
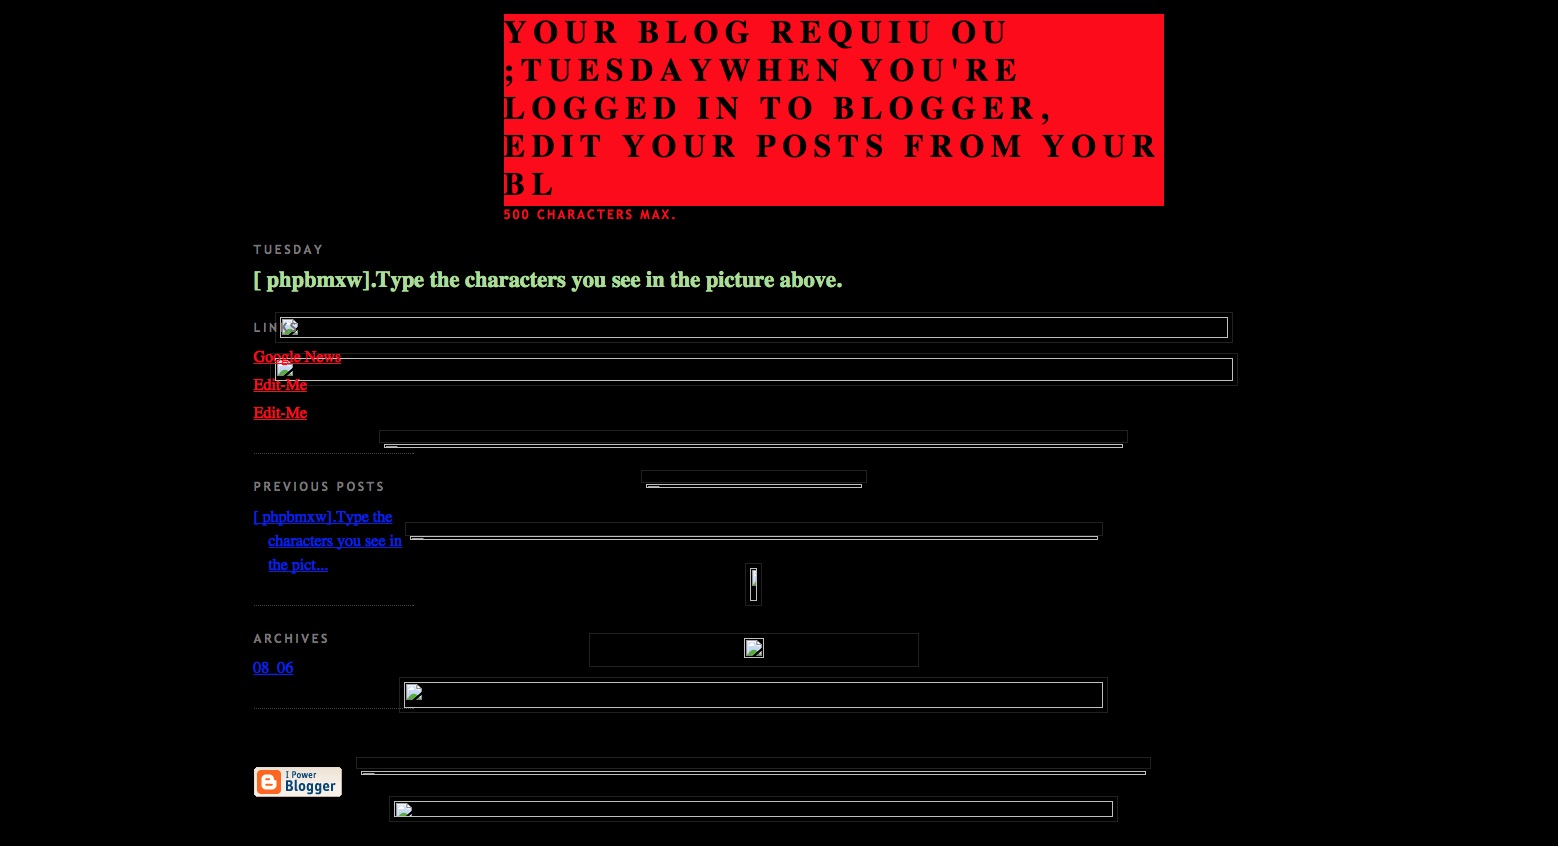
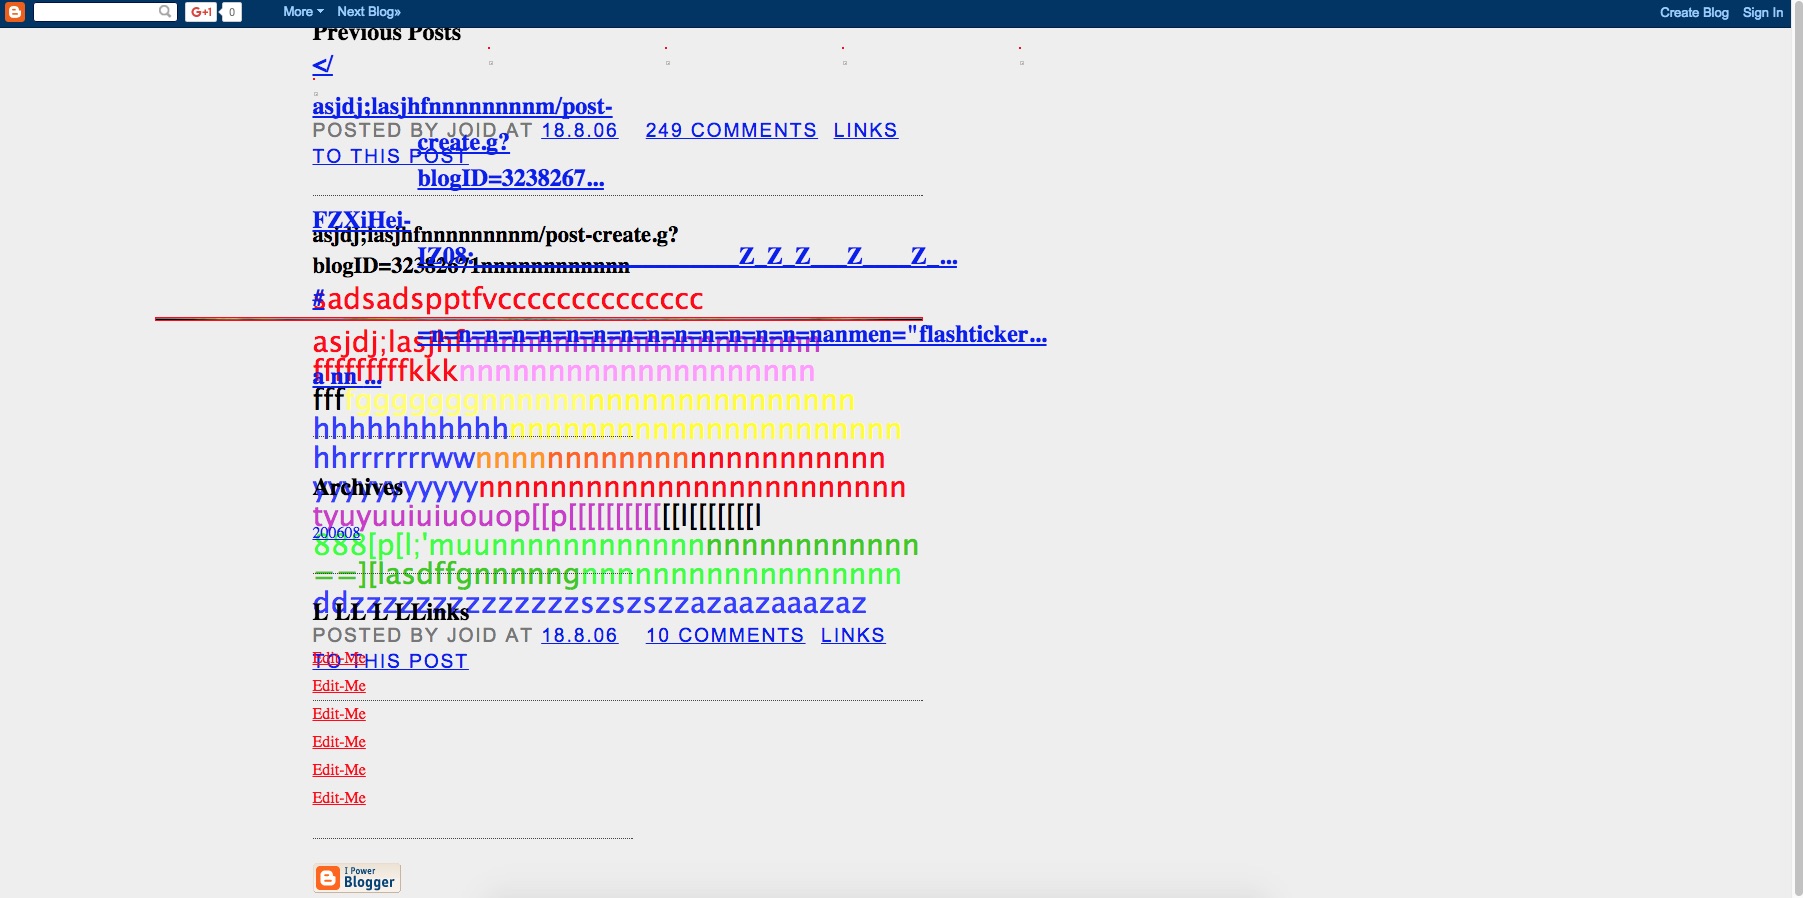
- interconnected digital narratives, besides the blog, my source material comes from defunct web pages (insert screenshots)
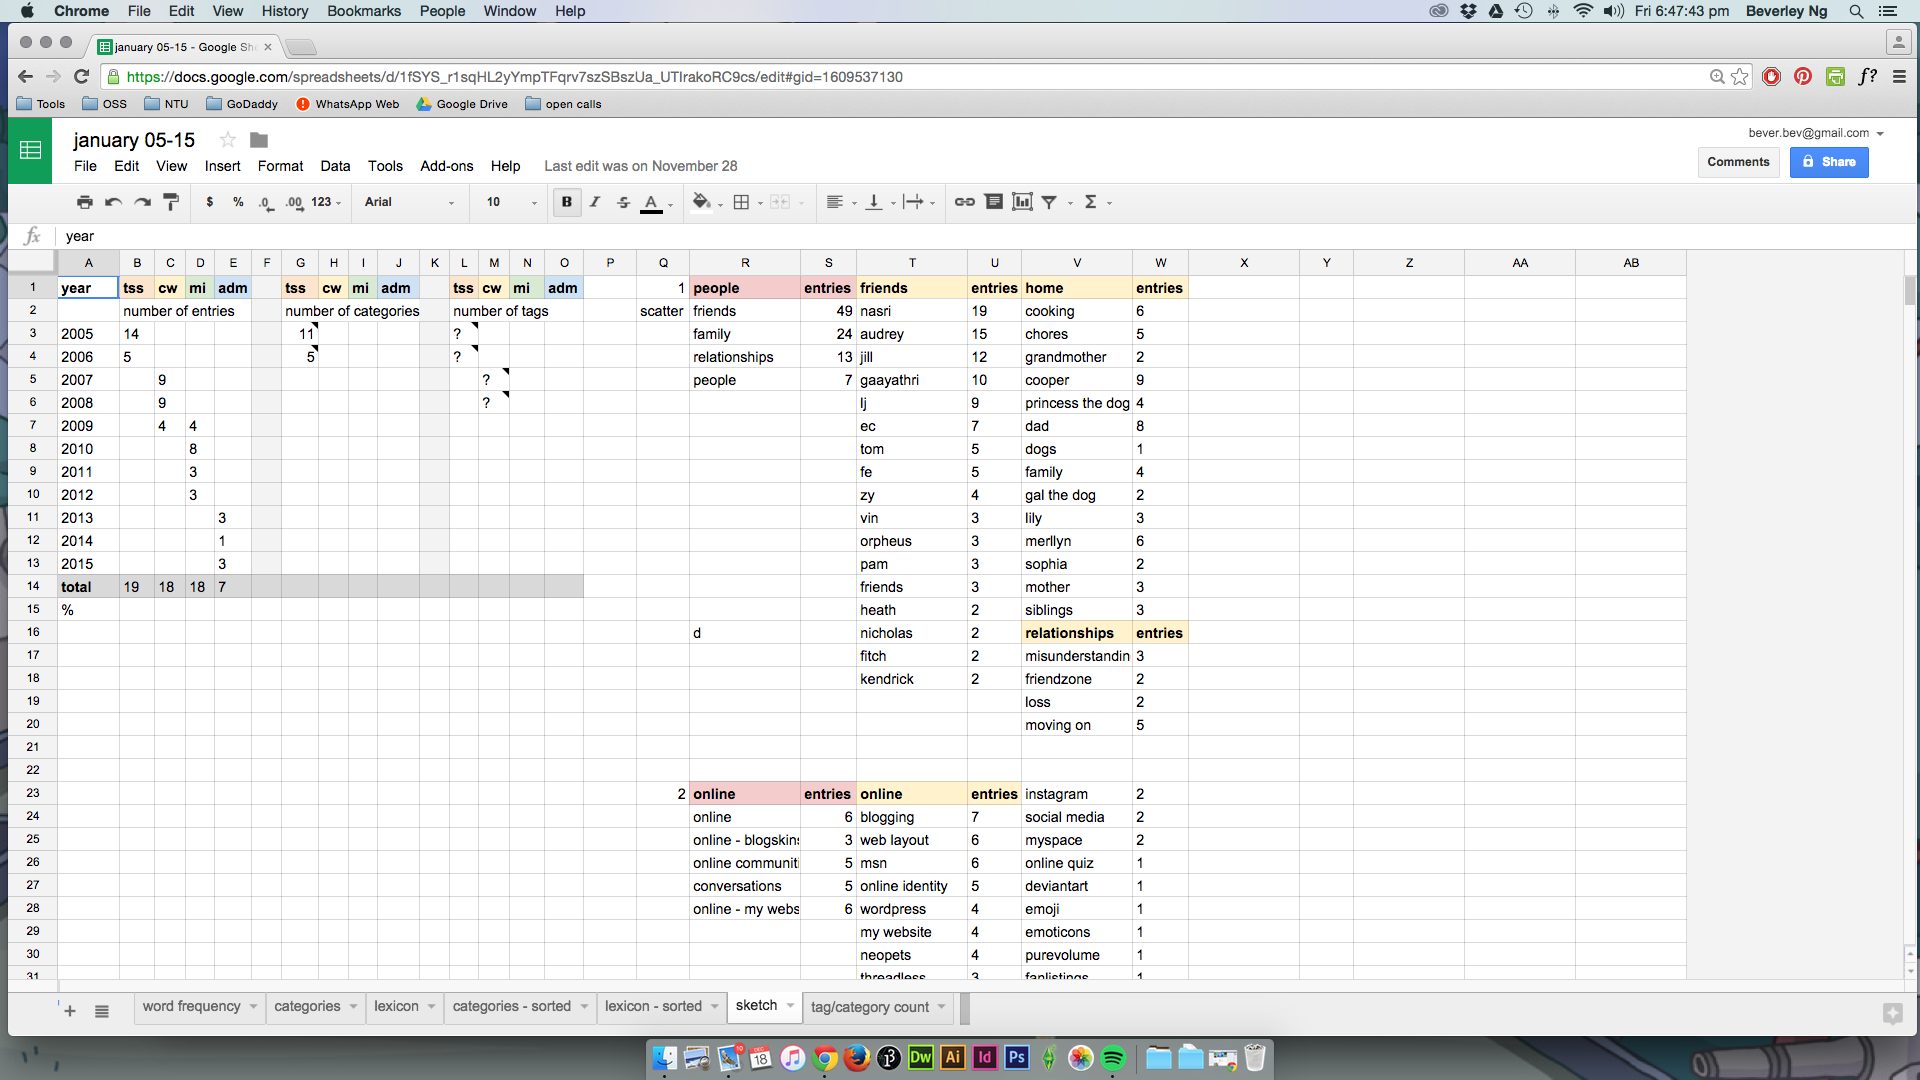
- identify time period that you look at the source material
- my life as a medium transporting experiential knowledge into visual remixes
- my memories of what it is i was doing when i captured my source material, by being an active participant online, by being a blogger, being a ‘heroine’ (online alter ego)
- virtual communities that provide us a suitable place to shape our personas
- the comfort of knowing who you can be and how much more accurate that portrayal of yourself can b, if you allow yourself to be online and making use of the necessary tools to shape yourself
- what visual vocabulary is involved when you are in the process of shaping this persona
- how did the shaping of an online, unalienated persona, shape my real, physical life and as an artist
- in the age of network cultures, the eye touches rather than it sees. it immerses itself in the tactile sense it feels when caught in the heat of the meaning making process
- part of a greater desire to become part of the socio cultural mosaic
- multilinear narrative environments. how is narrative distributed, how is it existing on the online space? narrative types? is html narrative
- adapting to new skins. collaborate with new technologies
- advent of the internet as globally distributed network of digital art created for artists and scholars to evolve alternative lives of inquiry that will have critical ramifications in our culture. in areas where we compose, publish, exhibit, distribute and network these knowledge
- breaking barriers: geographical, time
- progressive art practice integrated with info-driven community/society. online publication/exhibition
- utilisation of cross-media platforms embed research, thinking, self-reflection, in doing so, changing way artworks are communicated and accessed
- interactive digital art. data visualisation, further educate ourselves to perform in this dynamic, computer-mediated environment.
- transferring creative and critical skill sets to the information, data-driven age.
- internet is an opportunity to bring wider visibility to an individual’s art practice, creative process. such process can be shared immediately online, open a network of external lives in real/online life that gives artists and the work a more significant place.
- visual communication can expand and contribute to multimedia art/new media environment, including web publishing, digital narrative, wireless networking, interactive cinemma, artist e-books, motion picture graphics, data visualisation, online art exhibition, generative art, code art, database aesthetics
- to theoretically articulate, through critical visual design skills and transferring that skill set to the information age. using that visual skill set to create user interface, focusing on bringing that print/tactile experience to the screen, to issues like site navigation, program functionality
- to innovatively combine traditional visual communication practice and further expand on the existing function of print, emphasising on reconfiguring the conventional notions of reading, writing and accessing the print media
- to take into considertation, that data becomes a part of open-source, a material in itself, a narrative device
- the history and practice of net art before and after WWW. (include artworks)
- how other artistic media enabale us to place the emerging forms of digital art in their historical and aesthetic context
- students feel they have a certain amount of control over distribution of their work. with digital art they can immediately publish and exhibit their work
- sites, homes, texts, digital being, all takes place in the placelessness of cyberspace
- repeated gifs of defunct websites
- rethinking representation: moving beyond the knowing and entering a world of immersive topographies that open up unknown narrative worlds composed of unstable identities
- my online persona character of Heroine
- how can i respond to the rapidly changing aesthetic, political and economic realities presented to our contemporary society with advent of computer, internet and social media?
- so much of our commercial and subversive art is developed with software apps that encourages the liberal use of modernistic practices, sampling, collage, tech gimmickry, engineered behaviours
- what we are doing is not all that new. looking for structural changes in these works and approaches, you are likely to find changes in mediums through which this art gets distributed and how emerging network culture transform the way we participate in appreciating and making art
- what is a blog? could be an autobiographical work in progress, surfs for data, sample, manipulation, and exhibited in a space that is more than just a diary web site